hparmar-dataviz-portfolio
| home page | data viz examples | Visualizing Government Debt | critique by design | final project I | final project II | final project III |
Chart: General Government Debt (% of GDP, 2020)
The chart below, sourced from the OECD, illustrates the percentage of general government debt as a share of GDP for various countries in 2020.
Japan and Italy show the highest debt levels (over 150% of GDP), while countries such as Estonia, Chile, and Türkiye have relatively low debt ratios.
The United States and Canada fall near the middle, indicating moderate debt levels compared to other major economies.
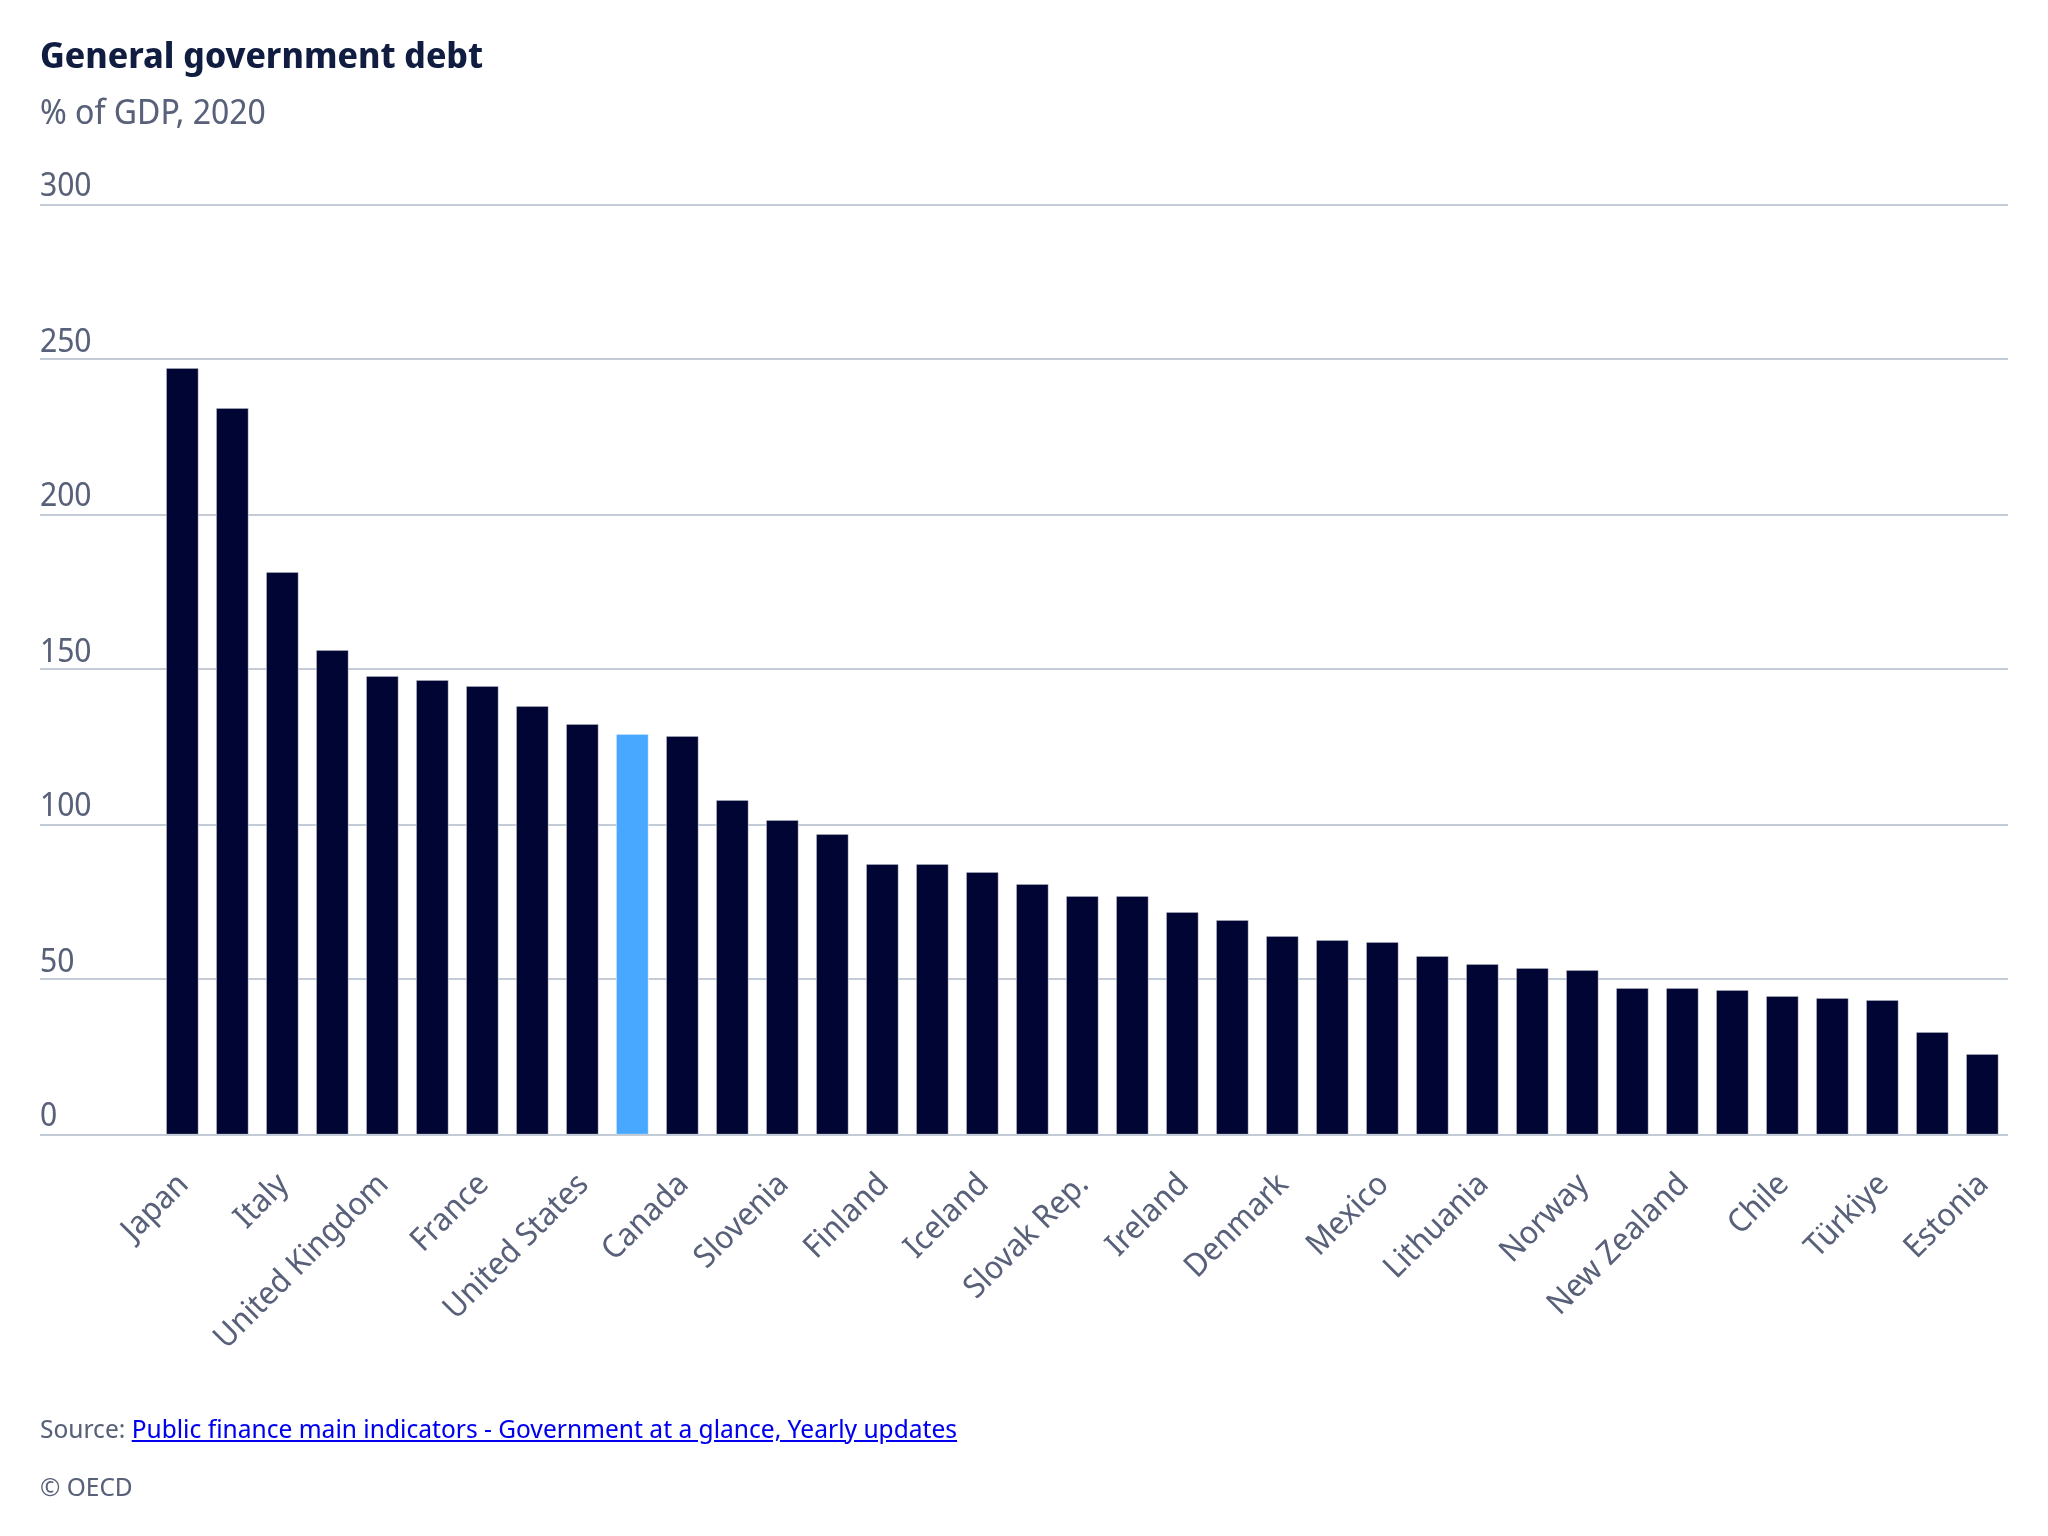
Source: OECD - Public finance main indicators: Government at a glance, Yearly updates

Who Holds the Largest Share of OECD Debt? (2018)
This visualization shows each OECD country’s share of total government debt in 2018, based on data from the OECD’s General Government Debt (% of GDP) dataset.
Each bar represents a country’s contribution to the total OECD debt, allowing for quick comparison of debt concentration among member nations.
The visualization reveals that Japan (8.7%), Greece (7.1%), and Italy (5.4%) hold the largest shares of OECD debt, followed by Portugal and the United States (both 5.0%). These findings highlight how debt burden remains concentrated among a few countries with historically high debt ratios relative to their GDP.
The x-axis displays the share of total OECD debt (in %), while the y-axis lists the countries in descending order. A sequential blue color palette was used for clarity and visual consistency.
Data Source: OECD - General Government Debt (% of GDP)
